tl;dr: re-running Dettmers’ 2022 “6.7 B outlier-feature phase-transition” experiment on 7 recent MoE and 5 Qwen3 dense models shows no sudden jump in layer coordination. the activation signature for the anecdotal 7B “intelligence threshold” seems to have vanished, probably thanks to post-2022 architecture/data changes, but further study on the question is required
exploration
reading RL rollouts while post-training small models, I noticed a huge gap in intelligence of models above and below ~7B parameters. twitter seemed to corroborate this, and it seems to actually be generally accepted folklore that different parameter counts just had emergent step changes in intelligence.
naturally my first thought upon finding this was ‘well is it 7B total or active’. I think the tweets I saw were talking about dense models, so it wasn’t exactly clear what the answer would be here. digging through the threads, I found references to Tim Dettmers’ 2022 paper on int8 quantization, and decided to read it.
in the process of getting int8 quantization to work, dettmers found what he called ‘outlier features’ in model residual streams. residual streams act as a communication channel for deep models to more effectively stack processing layers for more depth. rather than computing y = g_0(g_1(g_2(x))) and implicitly recomputing the output so far, models can instead compute y = x + g_0(x) + g_1(x) + g_2(x), where each layer reads from and writes to the shared ‘working memory’ accumulated so far.
outlier features are essentially specific dimension indices within the residual stream that had extreme magnitude values (>= 6.0, compared to typical ranges +- 3.5) that showed up across layers and tokens in the residual stream tensor.
the intuitive explanation is that transformers have two processing streams: one that processes inputs, and one that suppresses noisy features that aren’t relevant to the current context. dedicating specific hidden dimensions to feature removal means that layers can coordinate, and know which dimensions can be multiplied by large values to suppress other features. (more on this here)
in particular, dettmers studied the presence of outlier features along layers, as well as along a given sequence’s tokens. in particular, he dubbed an outlier feature to be one that was present in at least 25% of the layers, 6% of the sequence positions, and magnitude at least 6.0.
here’s quick visualization of outlier features persisting through a layer’s computations. these tensors are in [batch, sequence, hidden_dim] format (shape 2,3,4), with typical values ranging from -3 to +3, but outlier dimensions showing values of 6-9:
input residual stream (dimension 2 has outliers):
-3   0   6  -2     0   3   6   1
-2  -3   6   1     3  -1   9  -3
-2   0   8   3     0  -2   6  -2

           +

layer contribution:
-1   1   1  -1     2  -1   0  -1
-1   1   1  -1    -2   1   0   1
 1   1   1   2     2  -2   0   2

           =

output residual stream (outlier persists in dimension 2):
-4   1   7  -3     2   2   6   0
-3  -2   7   0     1   0   9  -2
-1   1   9   5     2  -4   6   0
notice how dimension 2 (third column, hidden dimension) maintains high values of 6-9 across all sequence positions in both batches, even after adding the layer contribution. this systematic appearance across layers and tokens is layer coordination
dettmers’ found that these extreme magnitude values in model residual streams started to systematically coordinate across layers around ~6.7B parameters. he called this a phase transition and claimed that ‘transformers after the phase shift at 6.7B parameters behave very different to transformers before the phase shift … one should not try to generalize from <6.7B to beyond’. this is a pretty strong claim, so I thought it would be important for my own experiments to find out how this claim held up for MoE models.
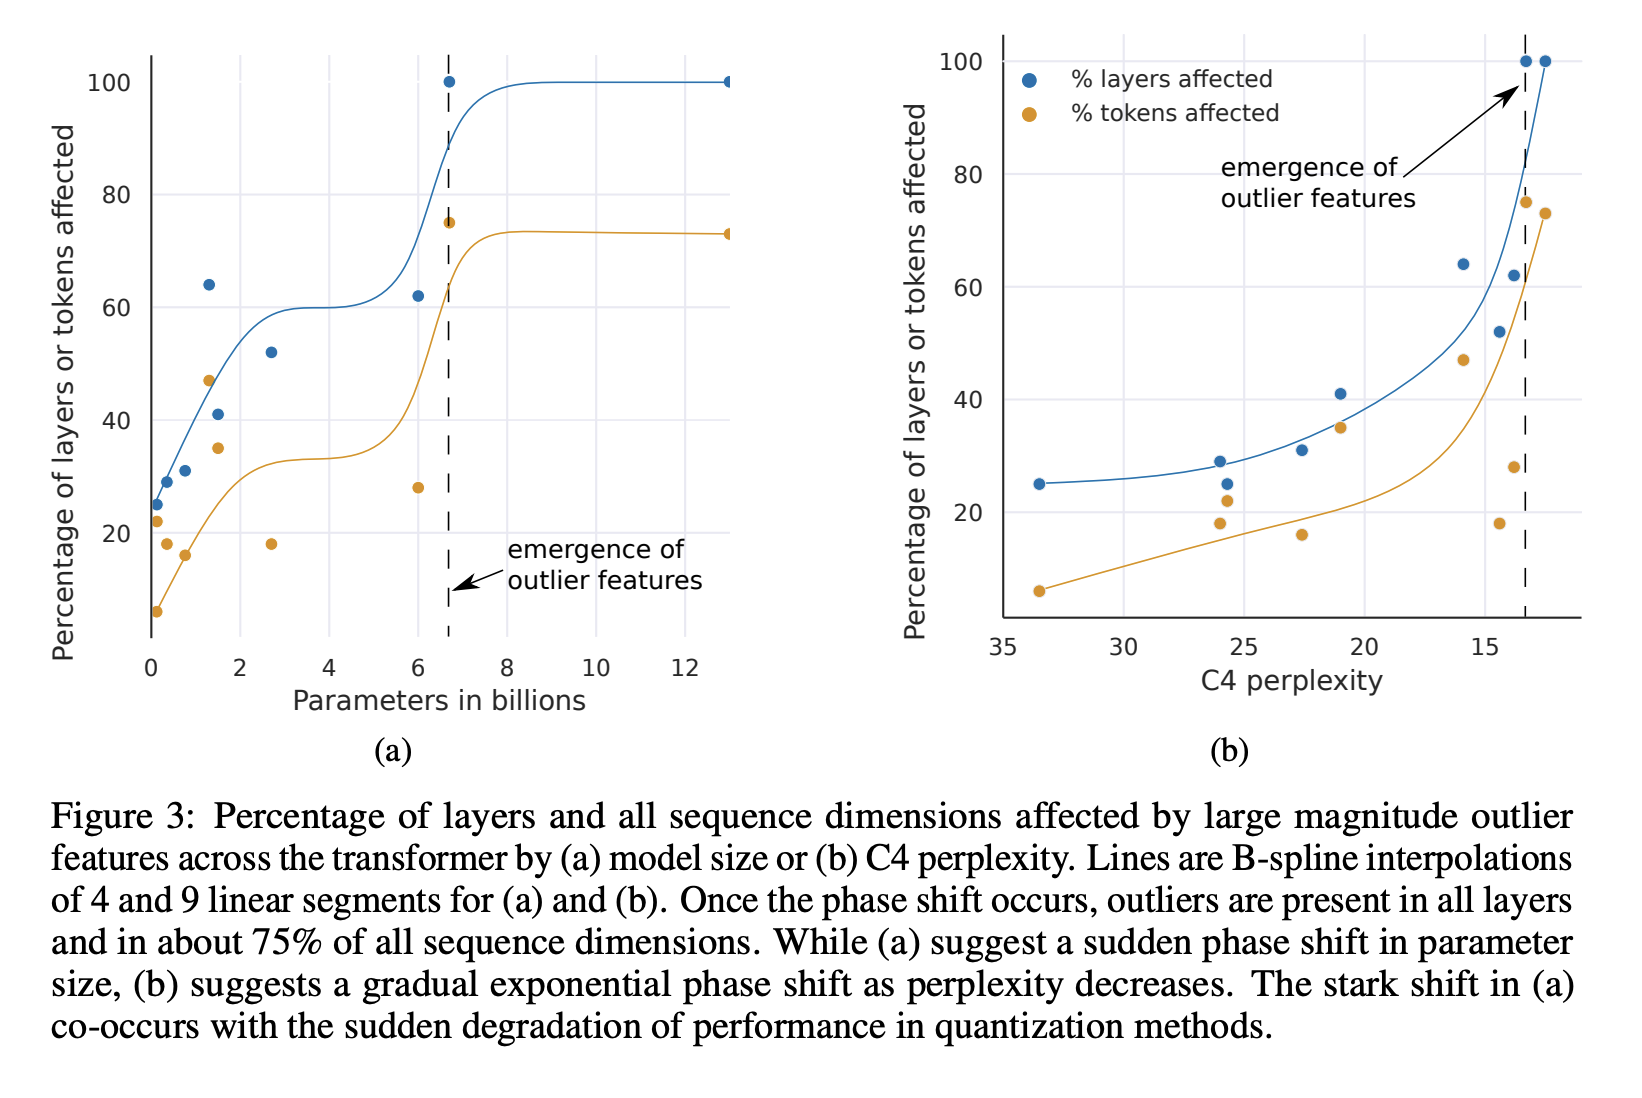 figure 3 from Dettmers et al. (2022): percentage of layers and sequence dimensions affected by large magnitude outlier features across transformers by (a) model size or (b) C4 perplexity. shows the phase transition at ~6.7B parameters.
so i ran the experiment Dettmers’ did. i swept over 7 MoE models that have come out recently, to try to pinpoint a phase transition point, either based on active/total parameters, or perhaps even related to the sparsity. i suspected it would be based on total params, since that would be more related to ‘total model capacity’, or that we wouldn’t find it at all due to the router.
the MoE results were messy - basically no pattern. outliers ranged from 49 to 4,635, layer coordination (L%) was all over the place from 29% to 63%.
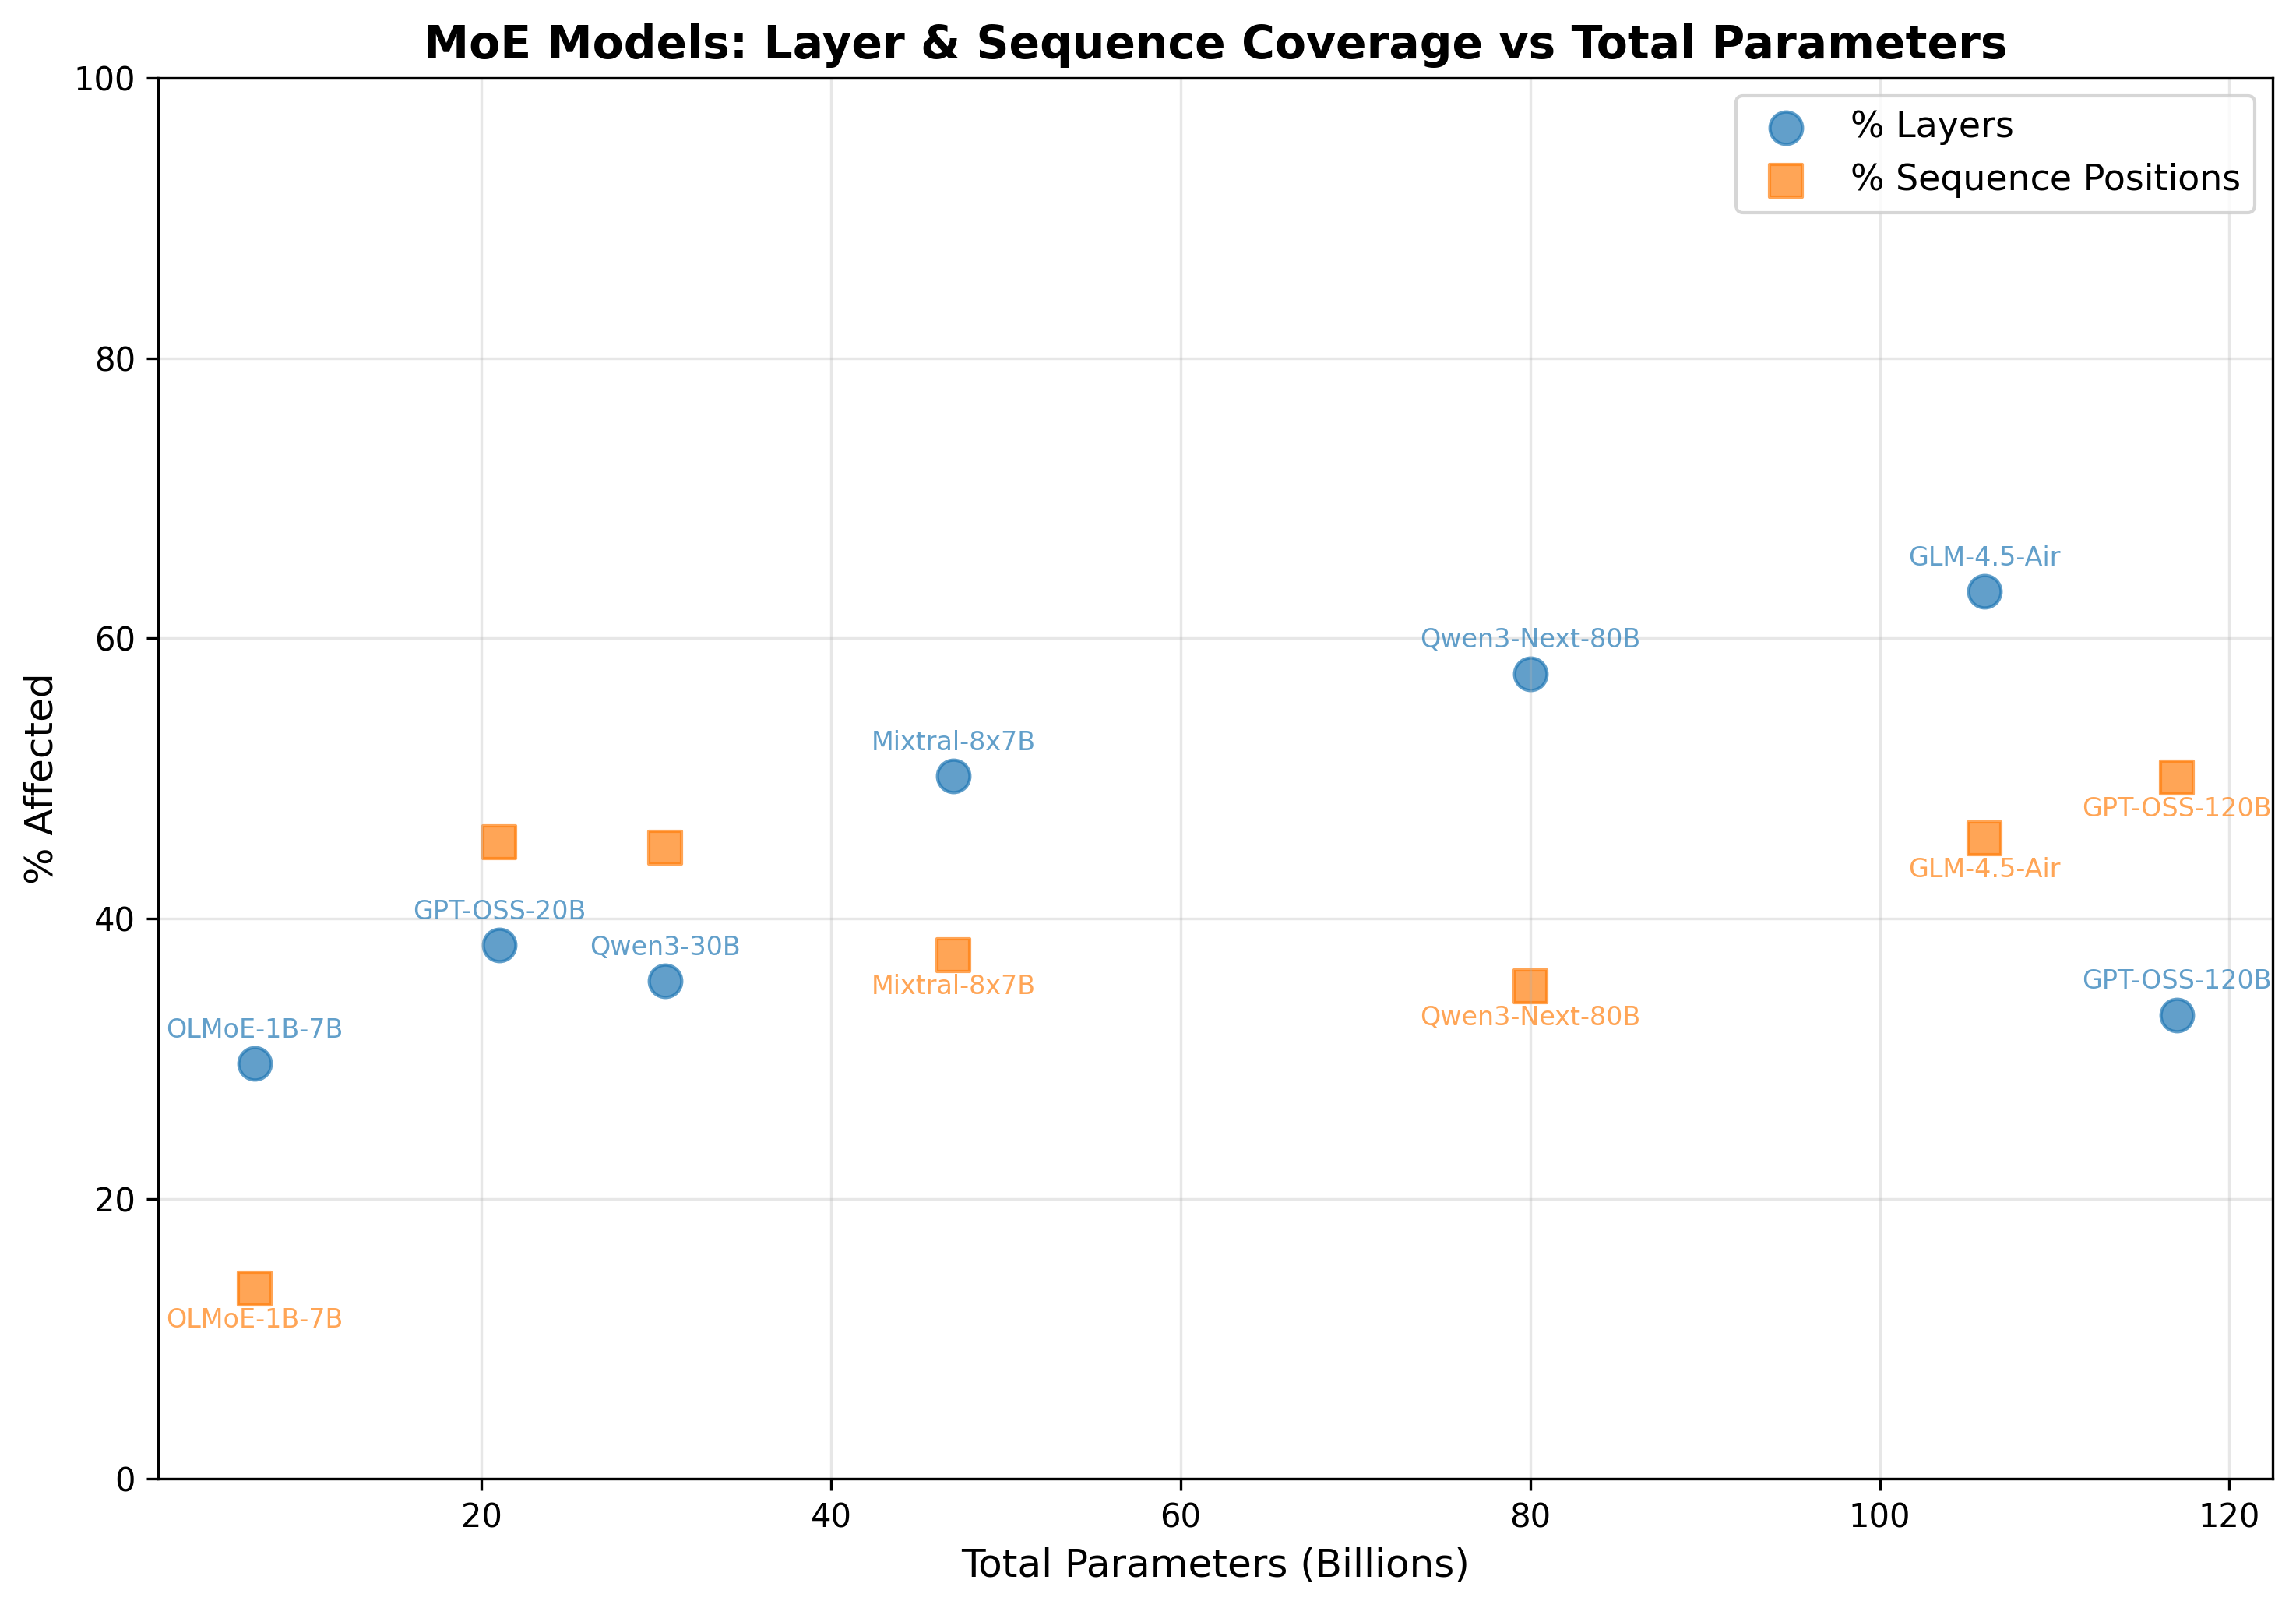 figure 1: no clear phase transition in MoE models when plotted by total parameters - both layer % (blue) and sequence % (orange) show erratic patterns
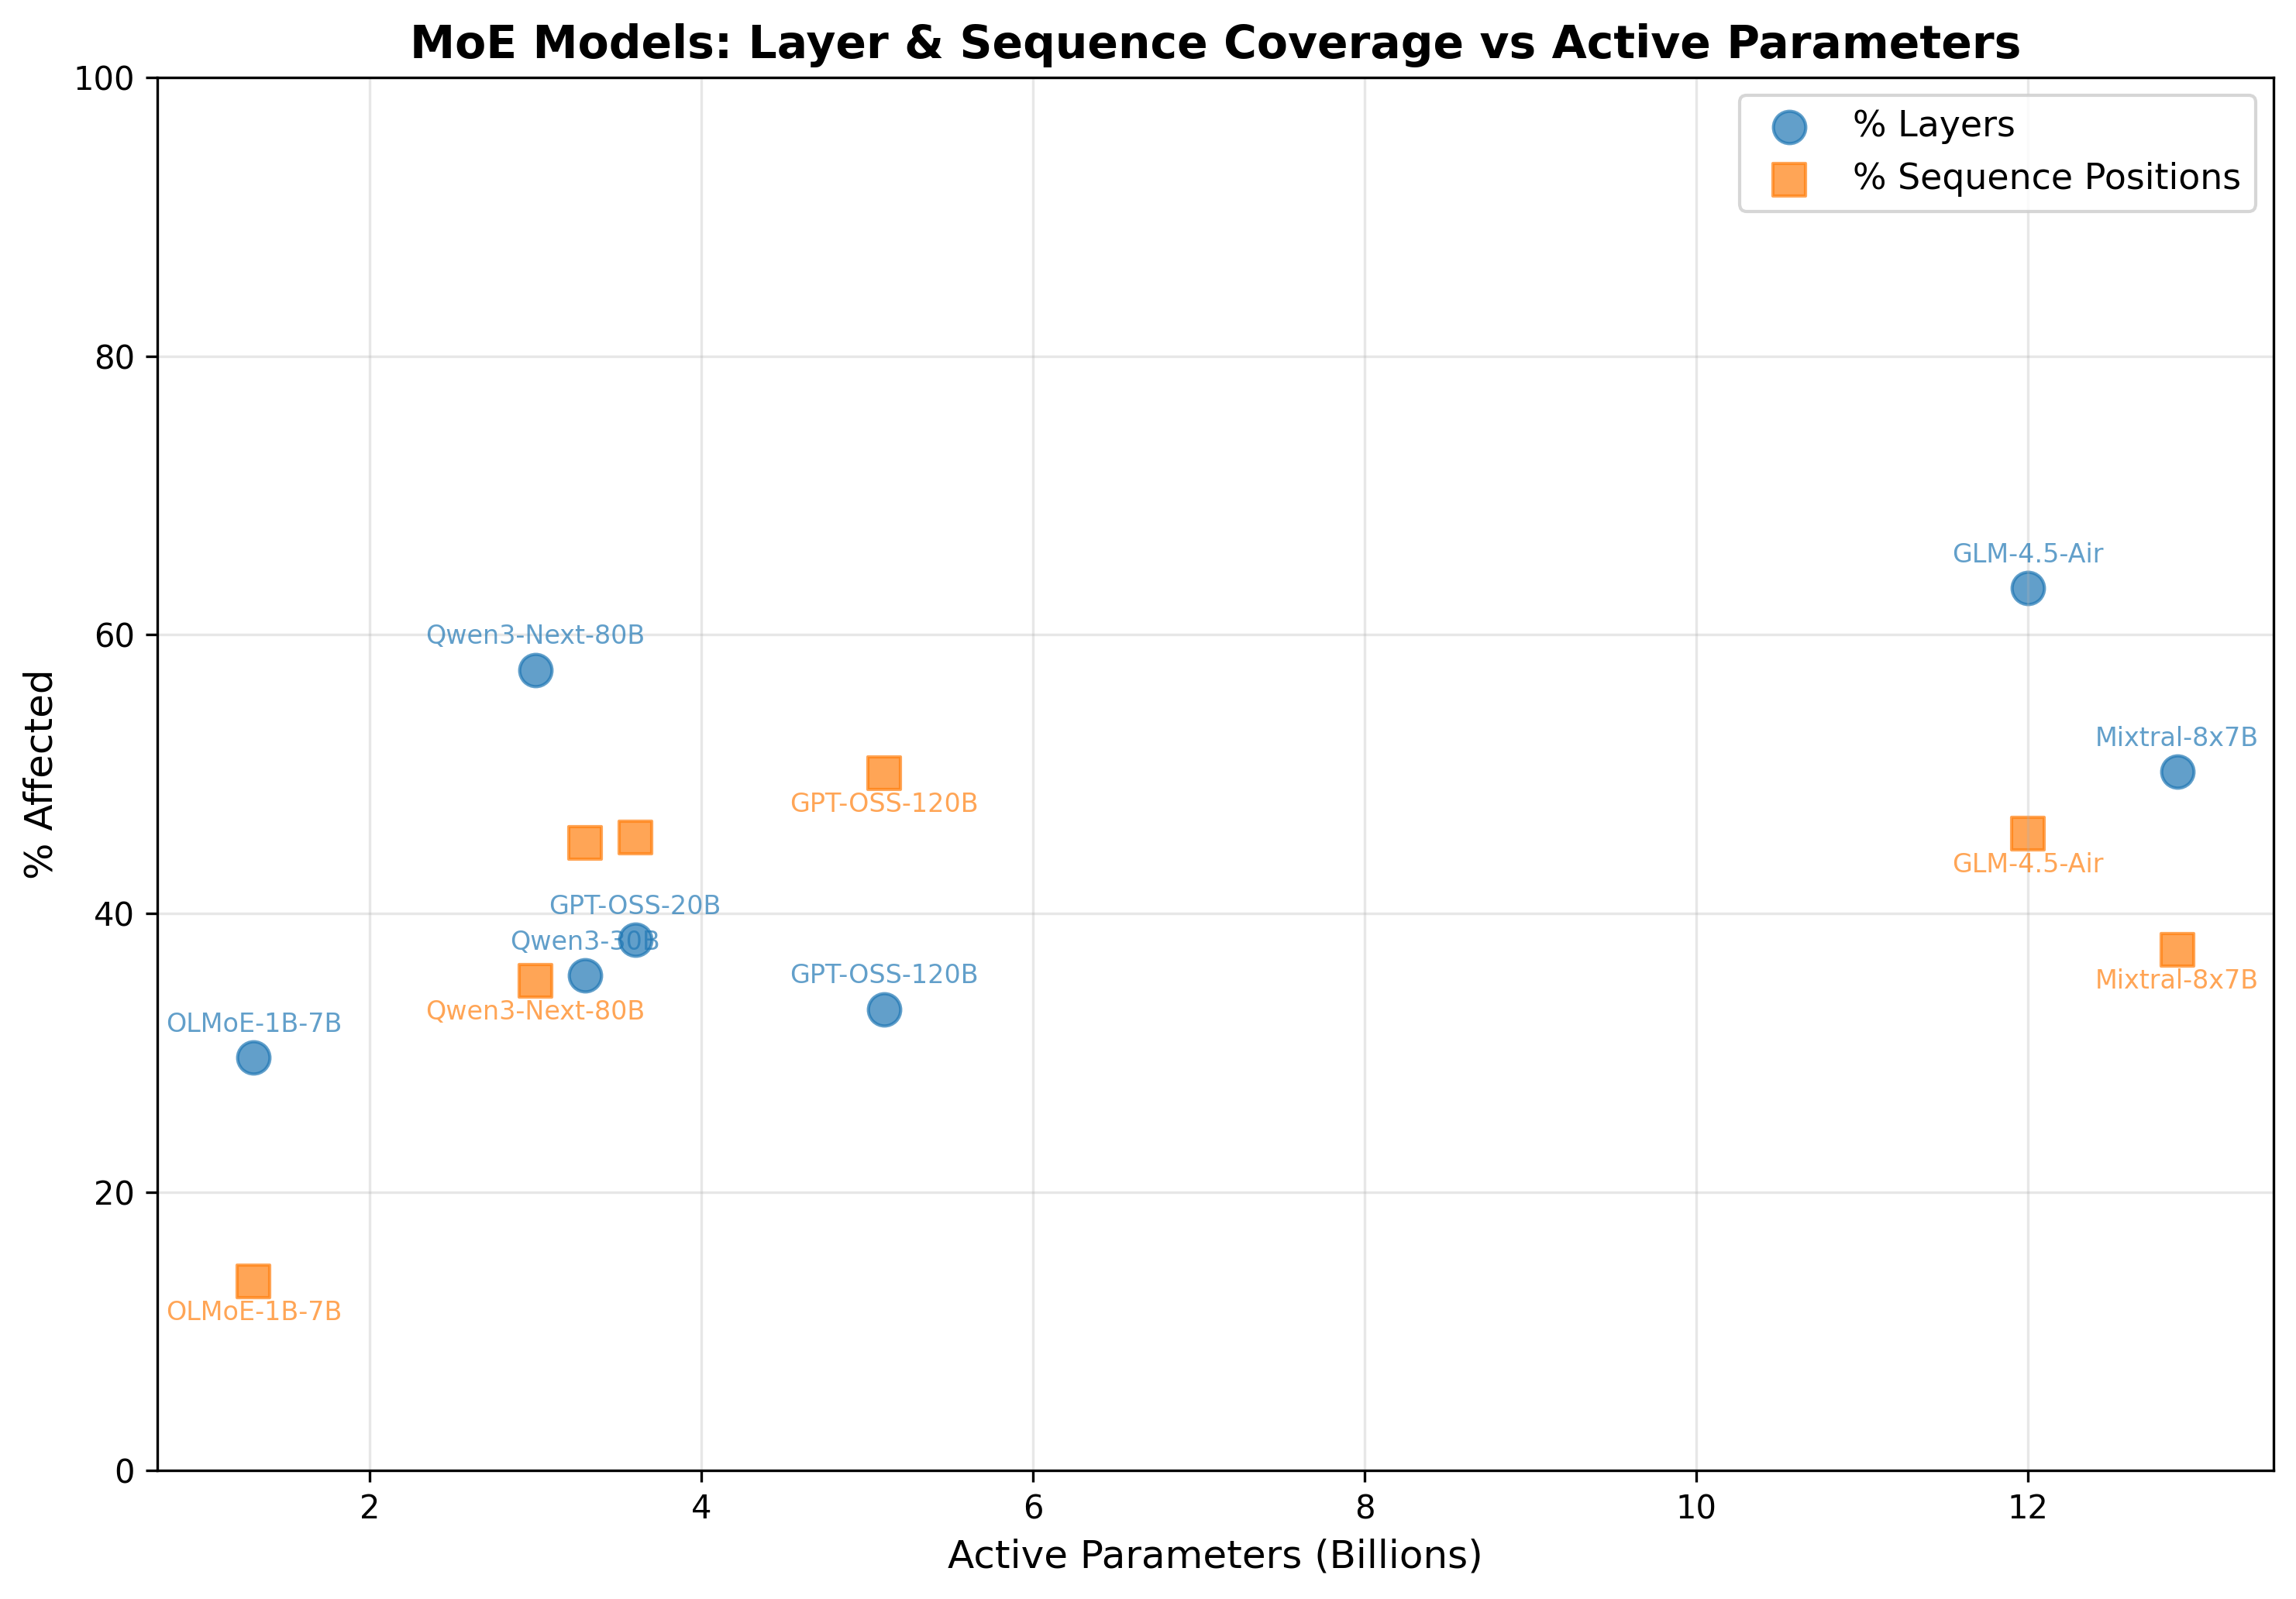 figure 2: similarly messy results when plotted by active parameters
so i thought my hypothesis about the routing was most likely. but then i remembered these were also 2024-2025 models, and Dettmers was using models from 2022, basically an eternity ago. to be rigorous, i decided to run another sweep on some frontier open dense models, specifically the Qwen3 series
here’s where it gets interesting.
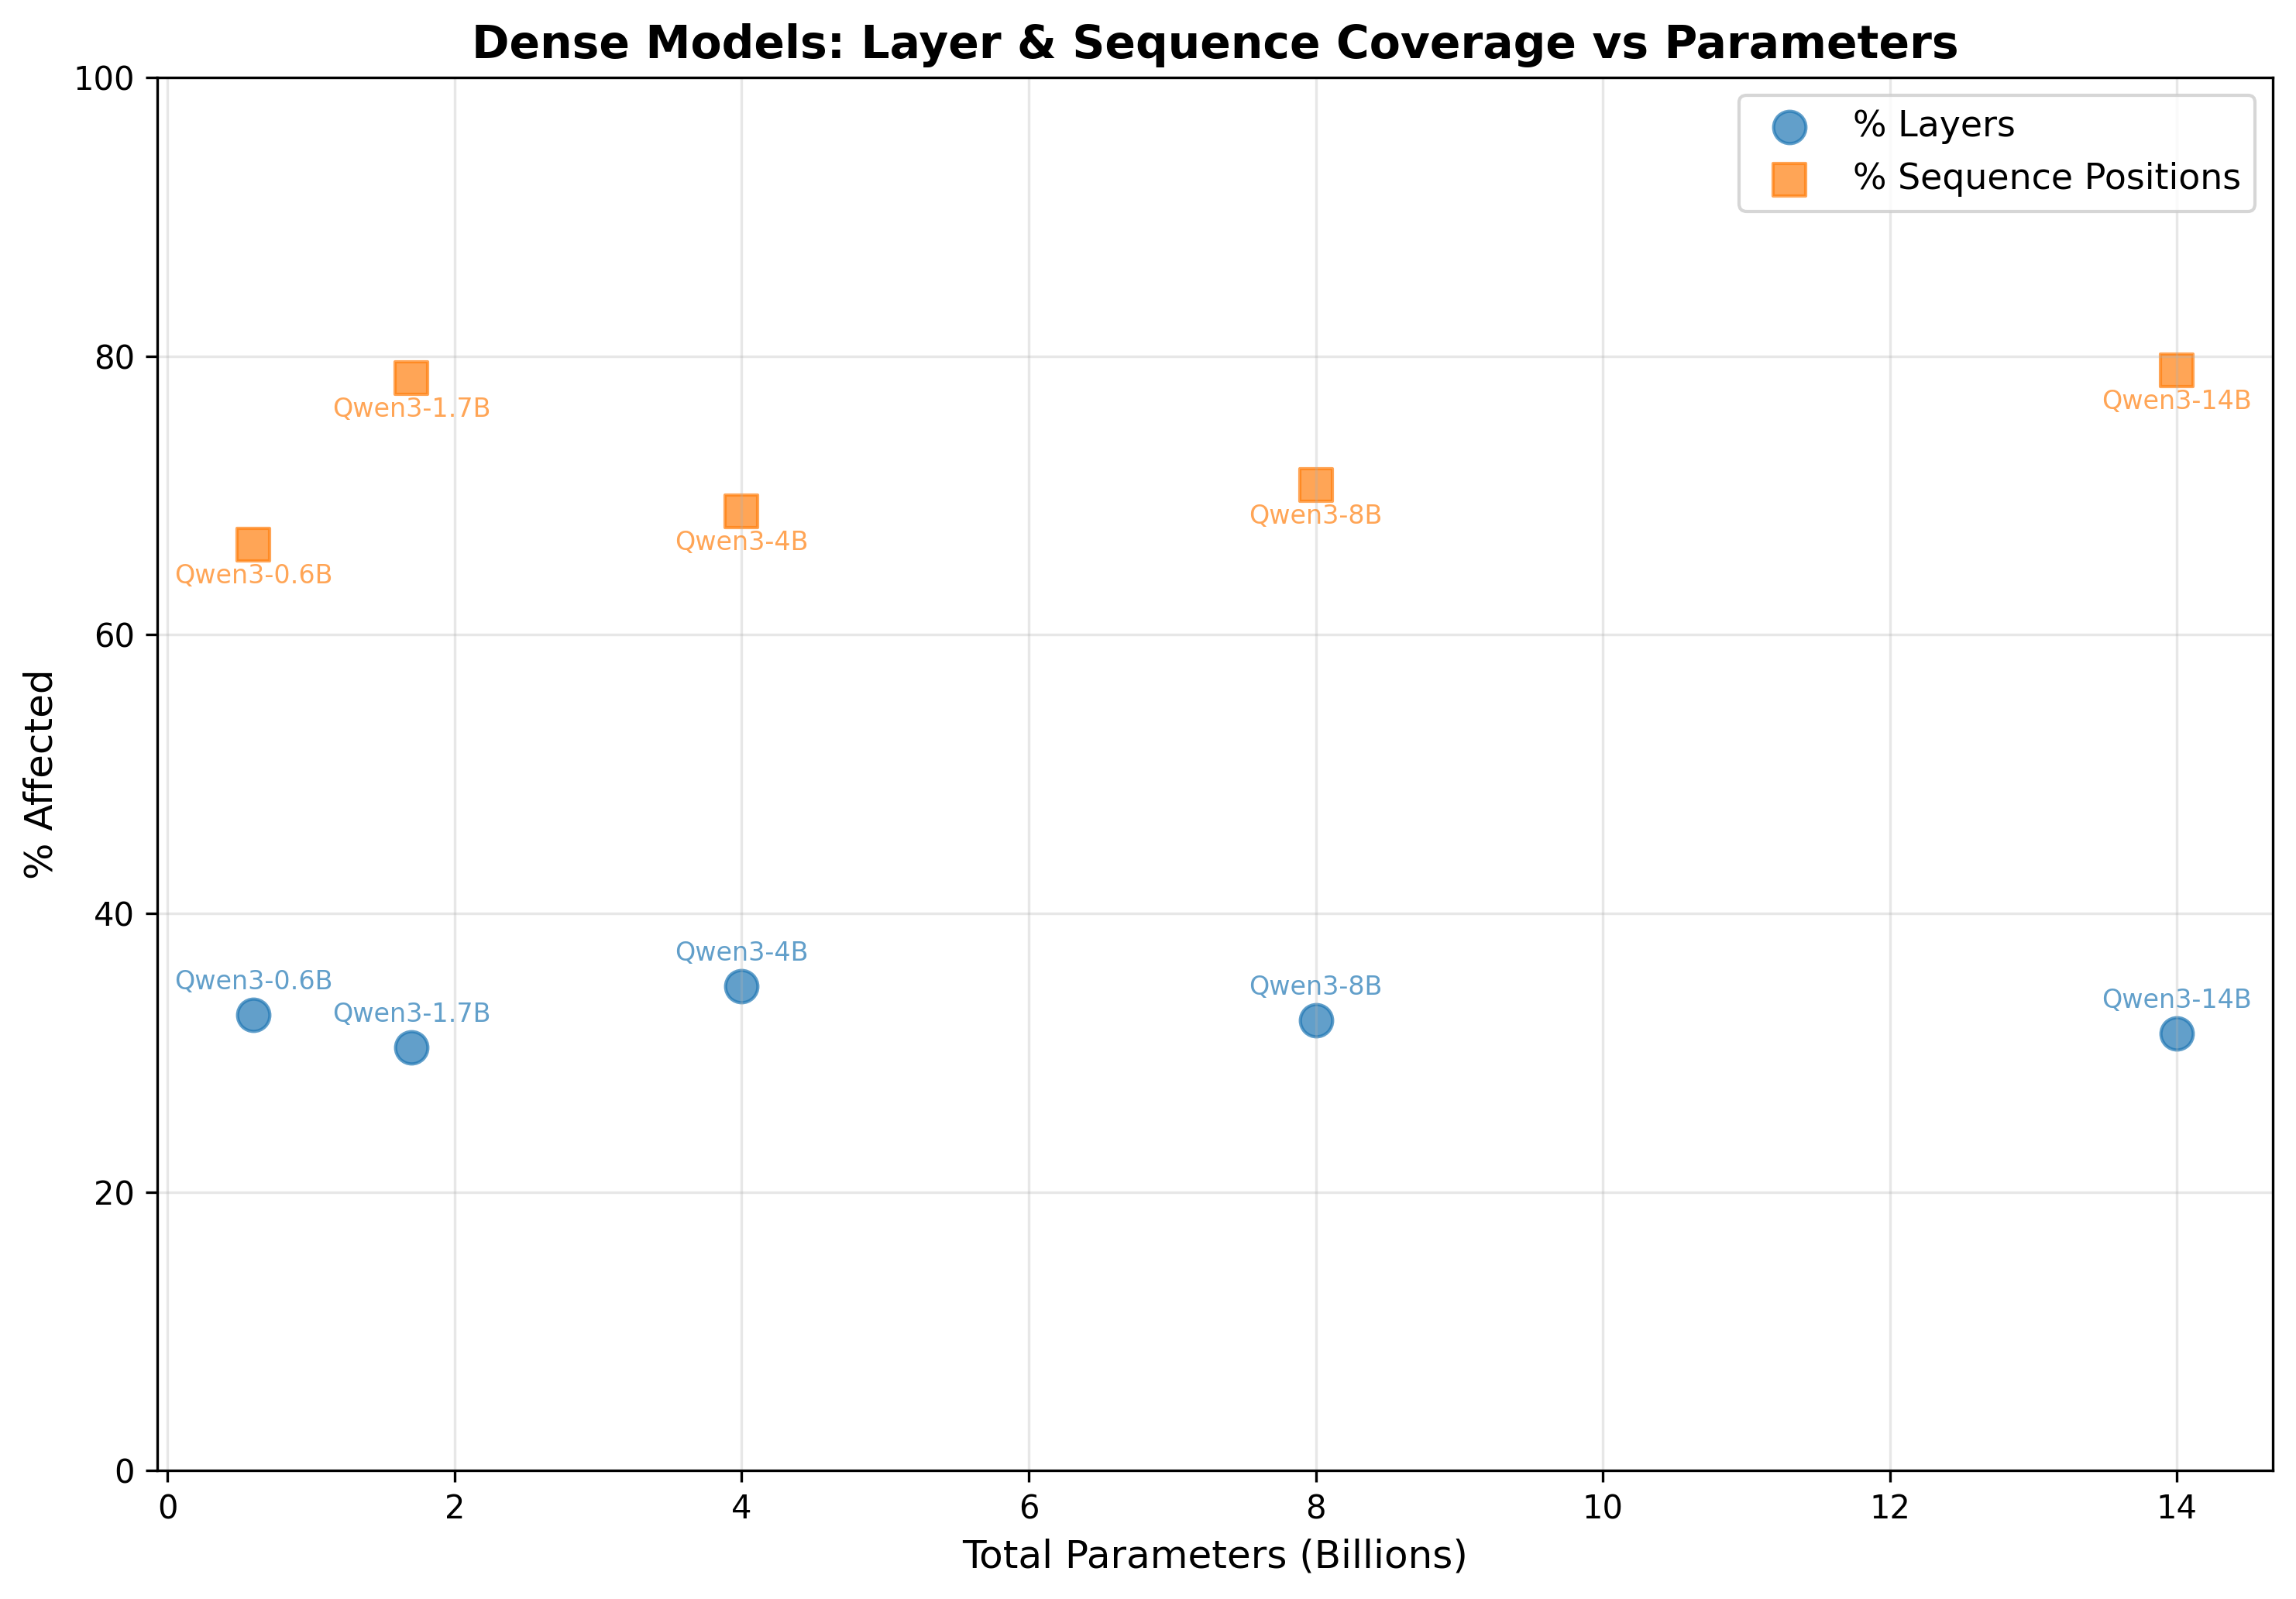 figure 3: qwen3 dense models show stable ~30% layer coordination (blue) and high ~66-79% sequence coverage (orange) across all sizes - no phase transition
instead of seeing the phase transition Dettmers found at 6.7B, i found ~30% layer coordination across ALL model sizes. no phase transition. interestingly, the sequence coverage is consistently high (~66-79%), meaning outliers still affect most tokens when they appear.
its not clear what’s changed between 2022 and 2025. one hypothesis is that we’ve had so many architectural improvements between now and 2022: RoPE, RMSNorm, new FFNs/activation functions like SwiGLU. so its hard to say what exactly might have changed the need for these outlier features.
additionally, new training datasets have become much more curated and filtered, and potentially higher signal. dettmers also found that the emergence correlated with model perplexity, not just model size. so higher quality data might have allowed models to learn feature representations that didn’t require the outlier mechanism.
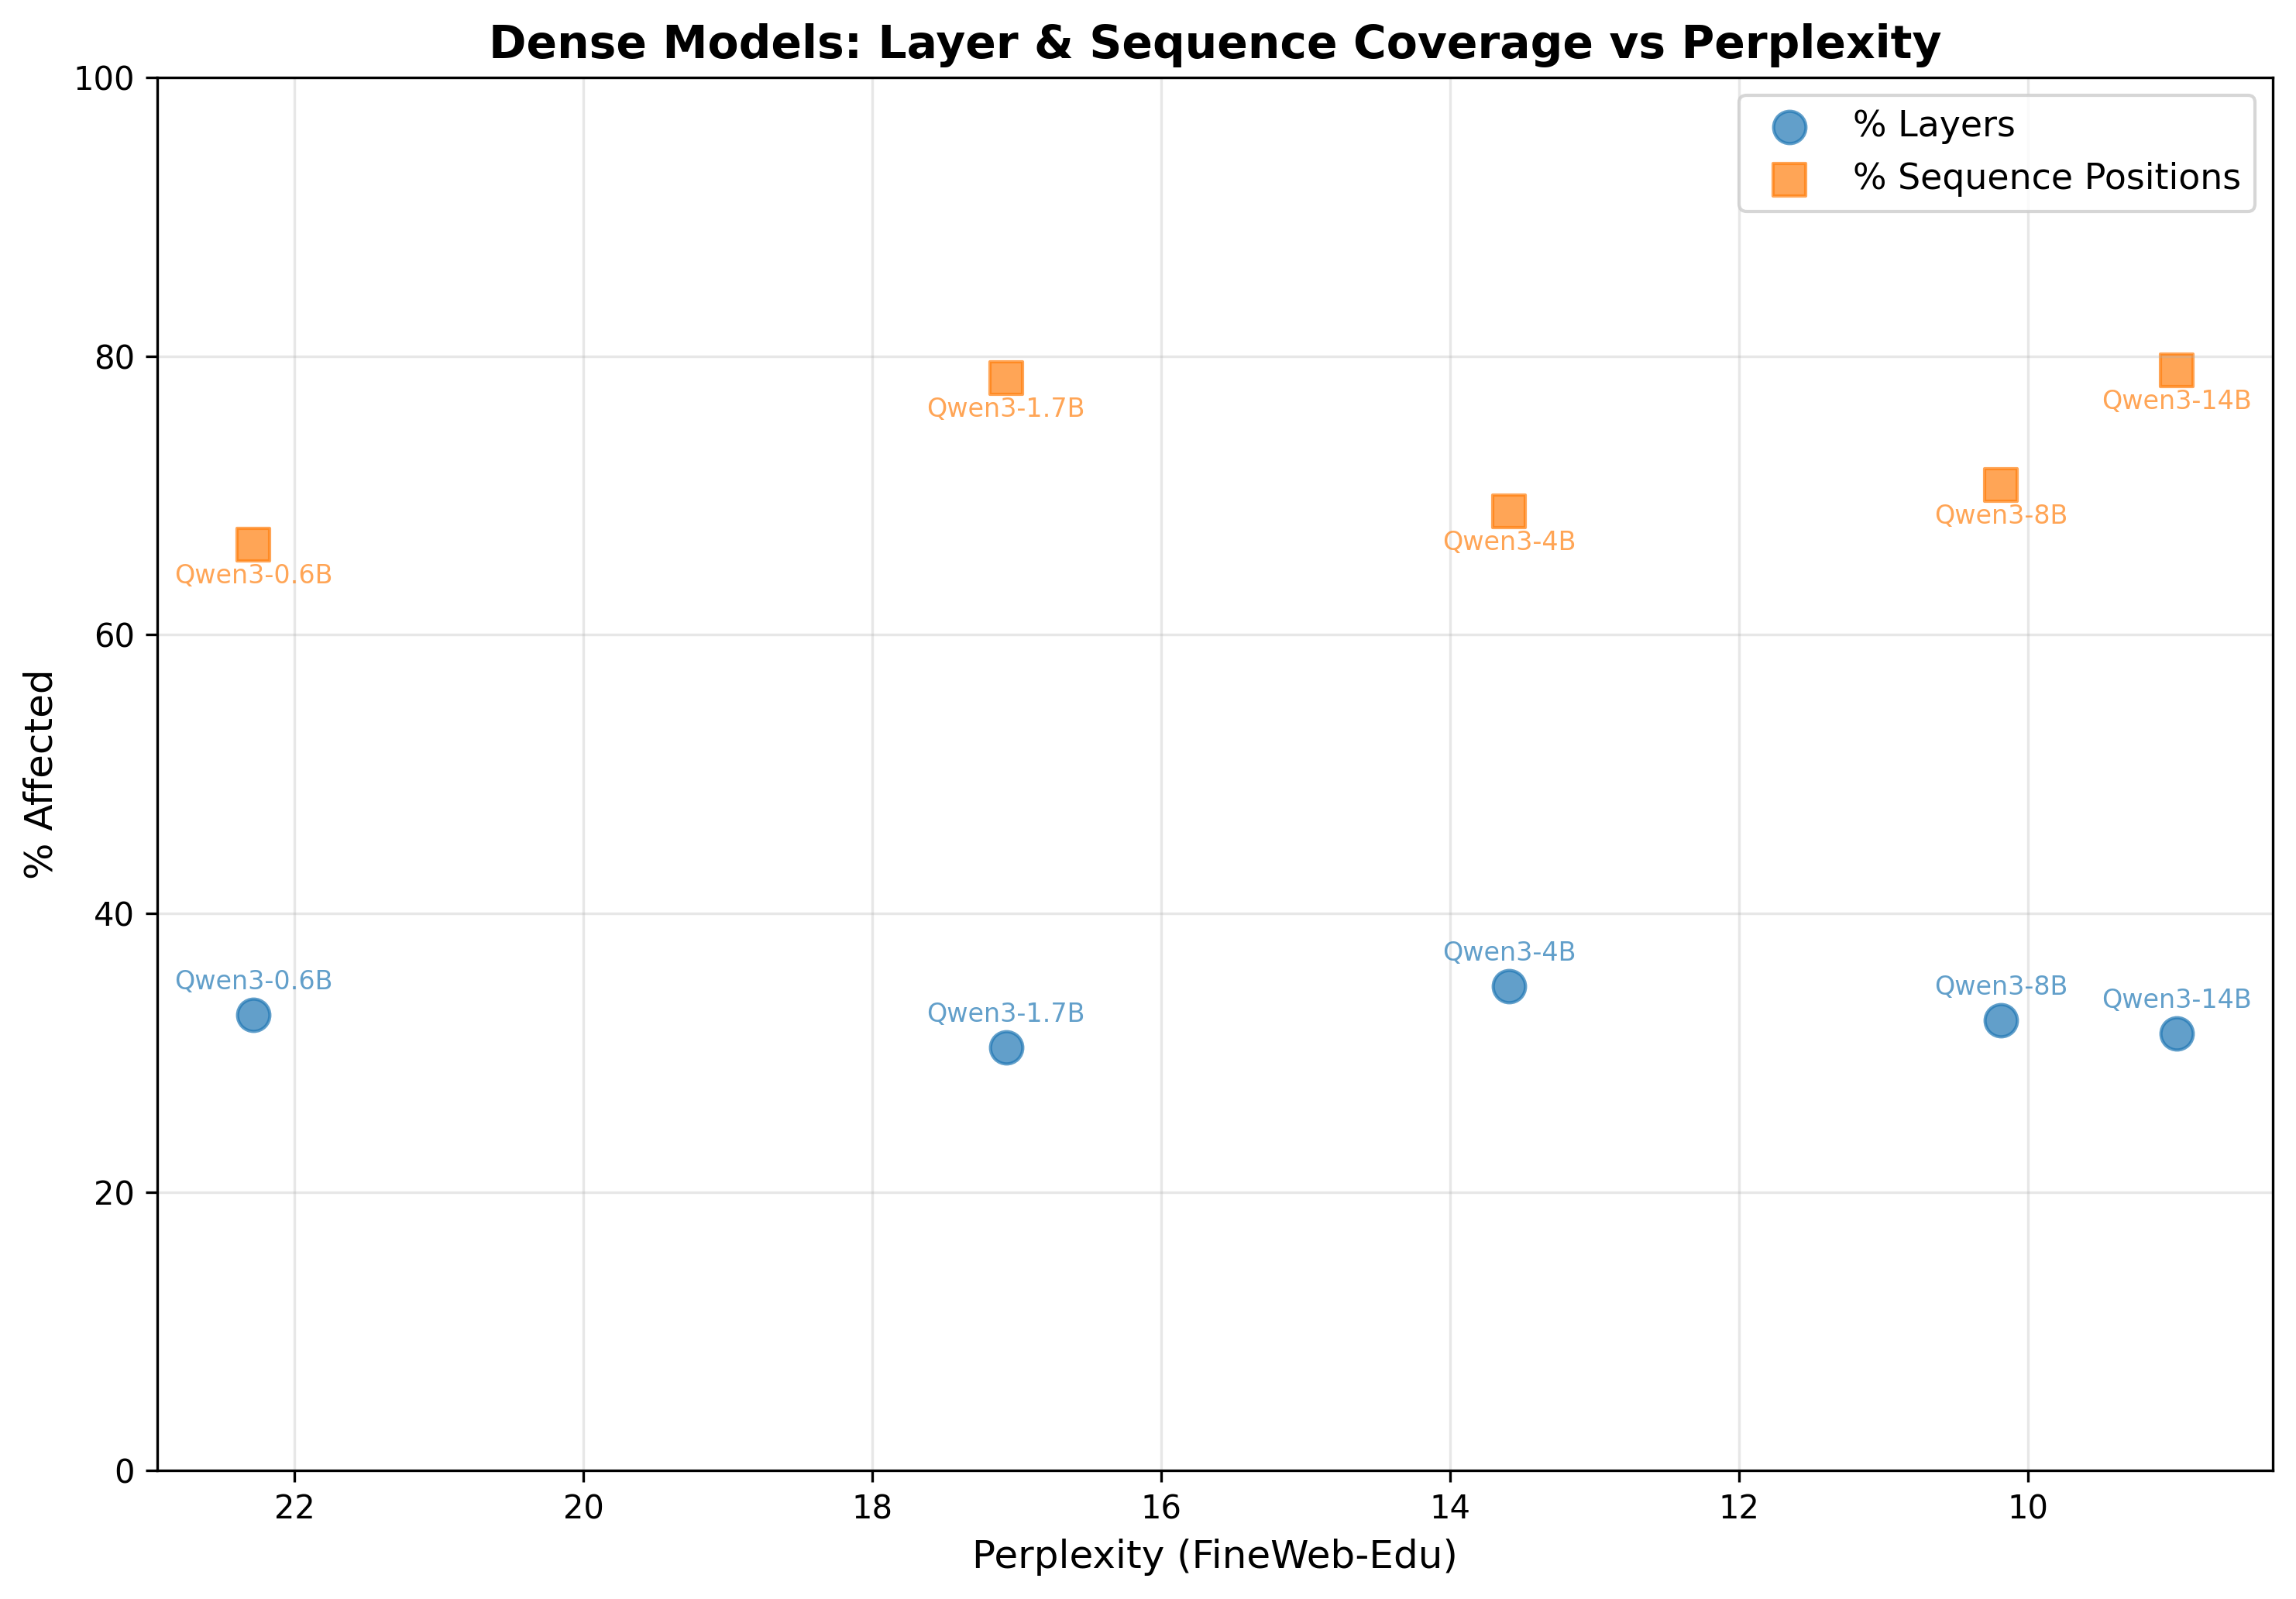 figure 4: plotting by perplexity (ranging from 8.97 to 22.28) still shows the same flat patterns - layer % (blue) remains ~30-35% and sequence % (orange) stays high at ~66-79%. no correlation between perplexity and outlier emergence
finally, it might just be the case that the 7B intelligence threshold doesn’t really hold up at all. the stark difference in capabilities between models like Moondream, or Phi, at similar total parameter counts demonstrates that architecture and training data are more relevant to study than arbitrary parameter thresholds. perhaps in the past the parameter threshold alone was enough to make the distinction, with architectures and training data largely the same. but now post-training and divergent architectures make this threshold much harder to claim.
i’m still very interested in the meta question here of ‘whats the least amount of compute i can use for a given task’, and more mechanistic understandings of ‘why does that model feel smarter than that one’. further research might include the perplexity study that dettmers performed, or more rigorous investigation into benchmarks to find a better way to disambiguate this fuzzy idea of an ‘intelligence gap’. i think circuit analysis will also be relevant here, as described in https://transformer-circuits.pub/2025/attribution-graphs/biology.html#dives-addition.
below are some more details on methodology, and the code is available here for scrutiny. i’d love to get feedback/more thoughts in DMs/replies at x.com/arb8020. always happy to chat!
limitations
- only tested one modern dense family: qwen3
- could have tested more models from the same families in the MoE sweep
- gpt-oss-20b and gpt-oss-120b were quantized with mxfp4, much more than other models studied
- used fineweb-edu instead of C4. this study should be robust to dataset choice but thought i would mention this anyways
methodology
detection criteria
- replication of Dettmers 2022 Figure 3a
- detected outliers with magnitude ≥6.0 affecting ≥25% of layers AND ≥6% of sequence positions
- analyzed activation tensors from ln_attn and ln_mlp across all layers
- dataset: 16 sequences × 2048 tokens from FineWeb-Edu
MoE Models Results
| Model | Total Params | Active Params | Experts | Top-K | Routing | Outliers | Mean L% | Mean S% |
|---|---|---|---|---|---|---|---|---|
| OLMoE-1B-7B | 7B | 1.3B | 64 | 8 | Token-based (dropless) | 49 | 29.5% | 13.6% |
| GPT-OSS-20B | 21B | 3.6B | 128* | 4* | Standard top-k | 1,465 | 38.1% | 45.4% |
| Qwen3-30B | 30.5B | 3.3B | 128 | 8 | Standard top-k | 110 | 35.5% | 45.1% |
| Mixtral-8x7B | 47B | 12.9B | 8 | 2 | Standard top-k | 4,635 | 50.2% | 37.4% |
| Qwen3-Next-80B | 80B | 3.0B | 512+1 shared | 10 | Standard top-k | 504 | 57.5% | 35.1% |
| GLM-4.5-Air | 106B | 12.0B | 128+1 shared | 8 | Sigmoid gating (loss-free balance) | 459 | 63.3% | 45.7% |
| GPT-OSS-120B | 117B | 5.1B | 128 | 4 | Softmax-weighted top-k | 1,695 | 33.1% | 50.0% |
Note: Perplexity not reported for MoE models due to instruct-tuning and response format considerations.
Metric Definitions:
- L% = avg % of layers each outlier affects
- S% = avg % of sequence positions each outlier affects
- Experts = number of expert modules per MoE layer
- Top-K = number of experts activated per token
Dense Models Results
| Model | Total Params | Perplexity | Outliers | Mean L% | Mean S% |
|---|---|---|---|---|---|
| Qwen3-0.6B | 0.6B | 22.28 | 9,212 | 32.7% | 66.5% |
| Qwen3-1.7B | 1.7B | 17.08 | 16,563 | 30.3% | 78.4% |
| Qwen3-4B | 4.0B | 13.59 | 1,042 | 34.8% | 68.8% |
| Qwen3-8B | 8.0B | 10.19 | 777 | 32.3% | 70.8% |
| Qwen3-14B | 14.0B | 8.97 | 985 | 31.4% | 79.0% |
Model Precision Notes
| Model | Native Precision | Analysis Precision | Notes |
|---|---|---|---|
| OLMoE-1B-7B | float32 | float32 | Native precision |
| GPT-OSS-20B | MXFP4 (MoE weights) | MXFP4 | Native precision |
| Qwen3-30B | bfloat16 | bfloat16 | Native precision |
| Mixtral-8x7B | bfloat16 | bfloat16 | Native precision |
| Qwen3-Next-80B | bfloat16 | bfloat16 | Native precision |
| GLM-4.5-Air | bfloat16 | bfloat16 | Native precision |
| GPT-OSS-120B | MXFP4 (MoE weights) | MXFP4 | Native precision |